Nutrient chart · Fruiting crops
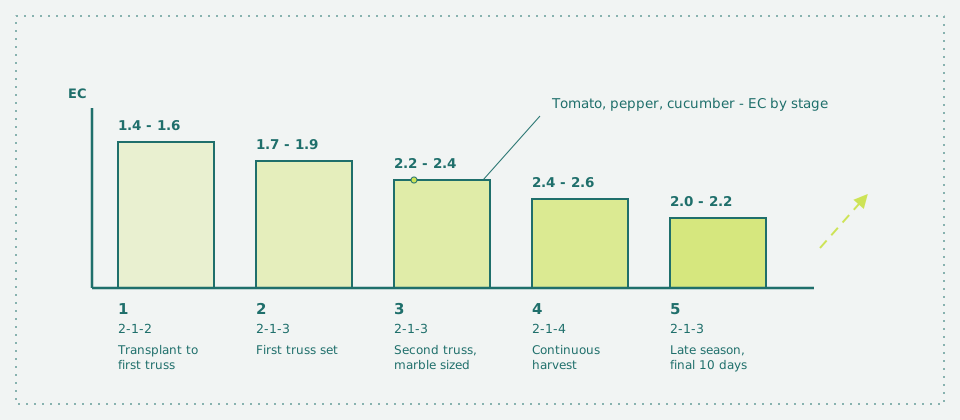
Fruiting Crop EC and pH Chart by Stage: tomato, pepper, cucumber
Fruiting crops are fed on a curve that rises through the season, and almost every home failure comes from applying the peak value too early or jumping to it in a single step. The stage markers here are tied to visible events on the plant, not to a calendar.
| Stage | EC | pH | N-P-K | Notes |
|---|---|---|---|---|
| Transplant to first truss | 1.4 - 1.6 | 5.9 - 6.1 | 2-1-2 | A young plant cannot use fruiting strength; pushing now costs two weeks |
| First truss set | 1.7 - 1.9 | 5.9 - 6.1 | 2-1-3 | Step up only after fruit has visibly set, not when flowers open |
| Second truss, marble sized | 2.2 - 2.4 | 6.0 - 6.2 | 2-1-3 | Peak demand; potassium uptake roughly triples over the vegetative stage |
| Continuous harvest | 2.4 - 2.6 | 6.0 - 6.2 | 2-1-4 | Hold rather than climb; a sudden jump here causes blossom-end rot |
| Late season, final 10 days | 2.0 - 2.2 | 6.1 - 6.2 | 2-1-3 | Ease back so the last fruit ripens rather than the plant stalling |
Step up when the fruit sets, not when the flower opens
A tomato flower opens, gets pollinated, and only then begins to draw heavily on the plant's resources. Raising the EC when flowers open feeds a demand that has not arrived yet, and the excess salts sit in the root zone burning root tips that are still forming. Waiting until the fruit is visibly set — the size of a pea on a tomato, a marble on a pepper — matches the feed to the draw.
Potassium demand triples at the second truss
Through the vegetative stage a tomato takes up potassium and nitrogen at roughly similar rates. Once the second truss is filling, potassium uptake roughly triples while nitrogen stays flat. That is the reason the ratio moves from 2-1-2 to 2-1-3 and then 2-1-4: not because nitrogen becomes less useful, but because potassium becomes far more so. Keeping the same ratio at peak fruiting is one of the most common causes of a plant that ripens unevenly.
Blossom-end rot is a swing, not a shortage
On tomatoes and peppers, blossom-end rot appears when the plant cannot move calcium into a rapidly expanding fruit fast enough. The calcium is usually present in the solution. What fails is the transport, and transport fails when the root zone dries between cycles or the EC jumps suddenly. Raising calcium in the reservoir does not fix it; smoothing the irrigation does.
The pH window matters more as EC rises
At 1.5 mS/cm a pH drift to 6.6 costs you almost nothing. At 2.5 mS/cm the same drift starts precipitating calcium phosphate out of solution, and the precipitant is invisible until the plant shows a deficiency that the meter says cannot exist. Above 2.0 mS/cm, check pH daily rather than weekly.
Key points
- 1.4-1.6 mS/cm from transplant until the first fruit sets
- Step up on visible fruit set, never on open flowers
- 2.4-2.6 mS/cm at continuous harvest, with a 2-1-4 ratio
- Blossom-end rot follows dry cycles and EC jumps, not low calcium
- Above 2.0 mS/cm check pH daily; precipitation starts around 6.6
Sources
- Korean Journal of Horticultural Science — https://koreascience.kr/article/JAKO199911922406644.do
- University of Padova — https://thesis.unipd.it/retrieve/cf7c45ea-4318-4977-aeeb-b05a8217ce63/Flaim_Gabriel.pdf
- University of Arizona CEAC — https://ceac.arizona.edu/sites/default/files/Chapter%2010.pdf
- University of Illinois Extension — https://extension.illinois.edu/sites/default/files/illinois_extension_hydroponics_handouts.pdf
Please noteThese EC, pH and ratio values are general references for common fruiting cultivars in home systems. They vary with water supply, climate and nutrient brand. Mix to your product label; this is informational content, not professional horticultural advice.
- Dutch Bucket Tomatoes: two indeterminate plants, 60 L of reservoir, 17 weeks of harvest · Build manual · 5 Sept 2026
- Leafy Green EC and pH Chart by Stage: lettuce, mizuna, tatsoi, pak choi · Nutrient chart · 14 Aug 2026
- Soft Herb EC and pH Chart by Stage: basil, mint, parsley, coriander, dill · Nutrient chart · 24 Aug 2026
- Microgreen EC and pH Chart: 12 days on almost no nutrient at all · Nutrient chart · 25 Sept 2026